
Your ad is working.
The CTR looks good. Conversions are coming in. The CPA is under control.
So you increase the budget.
A week later, something feels off.
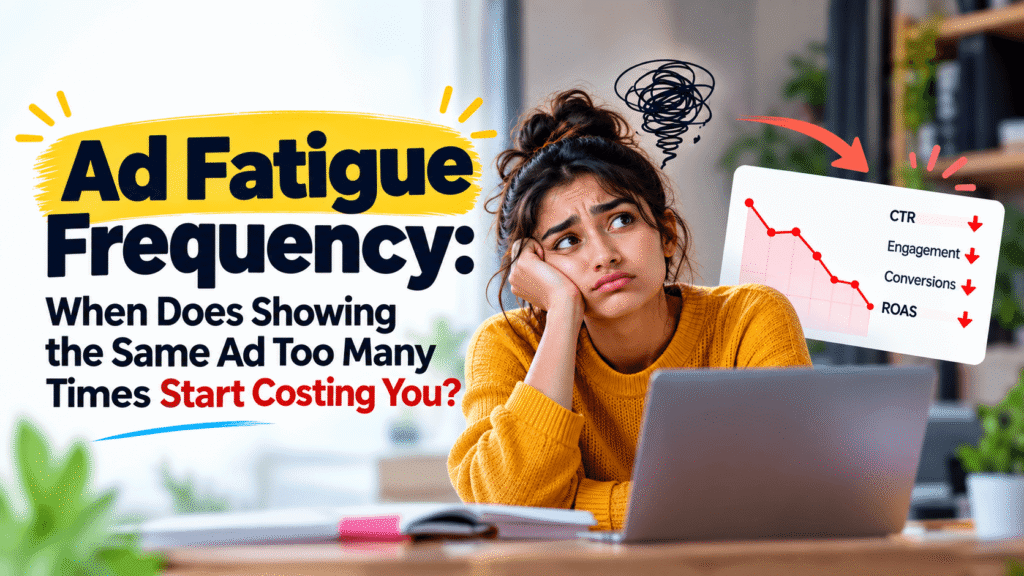
The same campaign is still running, but CTR has started falling. Cost per click is creeping up. CPA is getting more expensive. And when you look at the campaign, one number has quietly climbed:
Frequency.
This is where ad fatigue frequency becomes important.
Frequency tells you how often people in your reached audience are seeing your ads. Google defines frequency as the number of times a unique user sees an ad over a given period, while reach measures the number of unique people exposed to it.
The tricky part?
There isn’t one universal ad fatigue frequency number where every campaign suddenly breaks.
A frequency of 3 might be perfectly reasonable for one campaign and problematic for another.
That is why looking at ad fatigue frequency in isolation can lead you to the wrong conclusion.
The real question is:
When does repeated exposure stop helping and start hurting your campaign economics?
Let’s break down the data.
What Is Ad Fatigue Frequency?
Before looking for a magic number, let’s define the metric.
A simple way to calculate frequency is:
Frequency = Impressions ÷ Reach
For example:
- Impressions: 100,000
- Reach: 25,000 people
- Frequency: 4
That means the campaign generated an average of four exposures per reached person.
But “average” matters.
A frequency of 4 does not mean everyone saw your ad exactly four times. Some people may have seen it once, while others may have seen it much more frequently.
Google’s frequency distribution reporting exists for exactly this reason. It can show how many people saw an ad at least 1+, 2+, 3+, 4+, 5+, or 10+ times.
So when analyzing ad fatigue frequency, don’t just look at the headline average.
Look at how exposure is distributed.
Why Ad Frequency Isn’t Automatically Bad
Here is the first mistake marketers make with ad fatigue frequency:
They assume that more frequency = bad.
Not necessarily.
Seeing an advertisement more than once can be useful.
The first exposure introduces the message.
The second exposure may make the brand more familiar.
The third exposure might remind someone about a problem they were already considering.
A later exposure could finally get them to click.
This is especially relevant for consideration campaigns, where people may need multiple interactions before taking action.
Google even offers Target frequency campaigns for YouTube where advertisers can intentionally optimize toward a desired weekly or monthly frequency. Current supported target ranges vary by format, illustrating that frequency is something advertisers can deliberately manage rather than simply avoid.
So the goal isn’t:
“Keep frequency as low as possible.”
The goal is:
“Find the point where additional exposure stops producing enough incremental value.”
That’s the important distinction.
The Ad Fatigue Frequency Curve
Think about an ad campaign like this:
| Frequency | Typical situation |
| 1 | Initial exposure |
| 2 | Recognition begins |
| 3 | Repeated exposure |
| 4 | Potential diminishing returns |
| 5+ | Watch performance closely |
| 7+ | Stronger fatigue investigation may be warranted |
| 10+ | Requires context, audience type, campaign objective, and creative analysis |
These aren’t universal thresholds.
Industry practitioners commonly use ranges such as roughly 1.5–2.5 for cold prospecting and higher ranges for retargeting, but these are rules of thumb rather than official platform thresholds.
That’s why a better ad fatigue frequency analysis combines frequency with performance.
For example:
Frequency ↑ + CTR ↓ + CPA ↑
is much more concerning than:
Frequency ↑ + CTR stable + CPA stable
The second scenario may simply mean your campaign is successfully building repeated exposure.
The Data Pattern That Actually Signals Ad Fatigue
Let’s say you launched an ad with these starting numbers:
- CTR: 2.4%
- CPC: $0.80
- CPA: $22
- Frequency: 1.6
After another week:
- CTR: 2.1%
- CPC: $0.91
- CPA: $25
- Frequency: 2.8
Another week later:
- CTR: 1.6%
- CPC: $1.10
- CPA: $31
- Frequency: 4.2
Now we have a much more interesting pattern.
Frequency is climbing.
At the same time:
CTR is falling.
And:
CPA is increasing.
That combination gives you a much stronger fatigue signal than frequency alone.
Recent practitioner research similarly describes rising frequency combined with declining CTR and increasing costs as a more useful fatigue pattern than relying on a single frequency threshold.
This is why the most useful ad fatigue frequency analysis is trend-based.
Don’t ask:
“Is my frequency 4?”
Ask:
“What happened to performance as frequency moved from 2 to 3 to 4?”
That tells you much more.
When Does Ad Fatigue Frequency Start Affecting CPA?
This is where things get interesting.
Many marketers wait for CPA to increase before diagnosing fatigue.
That’s often too late.
CPA is an outcome metric.
Other signals can deteriorate before the CPA becomes obviously bad.
A simplified sequence can look like this:
Frequency rises → attention falls → CTR falls → CPC increases → conversion efficiency weakens → CPA rises
That doesn’t happen identically in every account, but it is a useful diagnostic framework.
Imagine your campaign starts here:
Frequency: 1.8
CTR: 2.5%
CPA: $20
Then:
Frequency: 2.7
CTR: 2.2%
CPA: $22
Then:
Frequency: 3.8
CTR: 1.8%
CPA: $27
Then:
Frequency: 5.1
CTR: 1.3%
CPA: $35
If you only monitor CPA, you discover the problem near the end.
If you monitor ad fatigue frequency alongside CTR, you may spot the deterioration earlier.
Google’s own reach and frequency reporting provides 7-day and 30-day frequency views specifically to help advertisers understand how exposure changes over time.
Why a Small Audience Can Create Ad Fatigue Faster
Here’s another important variable:
Audience size.
Suppose you have a $100 daily budget.
Campaign A:
- Audience: 1,000,000 people
- Budget: $100/day
Campaign B:
- Audience: 20,000 people
- Budget: $100/day
Campaign B can reach saturation much faster because there are fewer people available to receive the impressions.
As the available audience gets repeatedly exposed, ad fatigue frequency can climb quickly.
This is why simply saying:
“Frequency above X is bad.”
doesn’t work.
You need to consider:
- Audience size
- Budget
- Campaign objective
- Retargeting vs. prospecting
- Creative quality
- Number of creative variations
- Campaign duration
- Conversion cycle
- Brand familiarity
A small retargeting audience can naturally produce higher frequency than a large cold audience.
That doesn’t automatically mean the campaign is failing.
Cold Audiences vs. Retargeting Audiences
One of the biggest mistakes in ad fatigue frequency analysis is treating every audience the same.
Cold prospecting
Someone may have never heard of your brand.
Repeated exposure can become annoying relatively quickly, especially if the exact same creative keeps appearing.
A practitioner benchmark from YieldBI places prospecting frequency around 1.5–2.5 as a rough healthy range, while noting that these are not platform-published thresholds.
Retargeting
Now imagine someone visited your pricing page yesterday.
They already know what you’re selling.
Showing them another relevant ad isn’t necessarily the same as showing a cold prospect the same advertisement repeatedly.
Higher frequency may make sense.
Brand awareness
Awareness campaigns can intentionally seek repeated exposure.
The objective itself changes how you should interpret ad fatigue frequency.
That’s why frequency should always be evaluated alongside the campaign’s purpose.
The Real Problem Isn’t Frequency. It’s Repetition Without Incremental Value.
This is the concept worth remembering.
A frequency number doesn’t tell you whether an exposure was useful.
Imagine two campaigns.
Campaign A
The audience sees:
- Product demo
- Customer story
- Comparison ad
- Educational video
- Offer ad
Frequency = 5
Campaign B
The audience sees:
- Same image
- Same headline
- Same offer
- Same CTA
- Same image again
Frequency = 3
Which campaign is more likely to create creative fatigue?
You can’t answer that from frequency alone.
Creative variety matters.
The Play2Lrn Ad Fatigue Simulator is designed around this broader trade-off, letting you work with frequency cap, audience, budget, creative rotation, and relevance and see how recall, conversions, fatigue, and cost per conversion move together over a simulated campaign.
Try the Ad Fatigue Simulator on Play2Lrn
A 10-Week Ad Fatigue Frequency Example
Let’s build a simple example.
Suppose you’re running a campaign for 10 weeks.
At launch:
| Week | Frequency | CTR | CPA |
| 1 | 1.2 | 2.6% | $20 |
| 2 | 1.6 | 2.5% | $20 |
| 3 | 2.1 | 2.4% | $21 |
| 4 | 2.6 | 2.3% | $22 |
| 5 | 3.1 | 2.1% | $23 |
| 6 | 3.6 | 1.9% | $25 |
| 7 | 4.1 | 1.7% | $28 |
| 8 | 4.6 | 1.5% | $31 |
| 9 | 5.2 | 1.3% | $35 |
| 10 | 5.8 | 1.1% | $39 |
The exact numbers are illustrative, but notice the pattern.
Frequency doesn’t suddenly become “bad” at one magical point.
Instead, performance gradually changes as exposure accumulates.
Around weeks 5–7, you would want to investigate whether rising ad fatigue frequency is contributing to the declining CTR and rising CPA.
That’s much more useful than declaring:
“Frequency 4 is always bad.”
How to Diagnose Ad Fatigue Before CPA Gets Ugly
If you’re managing paid campaigns, build a simple weekly check.
Step 1: Check frequency
Is it increasing?
Don’t just look at lifetime frequency. Use a meaningful time window.
Google Ads provides average impression frequency over 7-day and 30-day windows, which can help you see changes over time.
Step 2: Check CTR
Is engagement declining while frequency increases?
If yes, that’s a stronger warning.
Step 3: Check CPC
If CTR is declining, your cost per click may rise.
Step 4: Check CPA
Now look at the business outcome.
Is the cost per conversion increasing?
Step 5: Check reach
If reach has flattened while impressions continue increasing, you may be showing the same audience more often.
Step 6: Check creative
Ask:
- Is the same ad doing most of the delivery?
- Have we introduced new hooks?
- Are we testing new formats?
- Is the message still relevant?
- Has the audience already seen this offer repeatedly?
This six-step process gives ad fatigue frequency much more context.
What Should You Do When Ad Fatigue Frequency Gets Too High?
Don’t immediately turn everything off.
First figure out why frequency is increasing.
Option 1: Refresh the creative
Test:
- New opening hook
- New visual
- New headline
- Different benefit
- Different proof point
- New format
- New CTA
Creative rotation can reduce the feeling of repeated exposure without necessarily changing the campaign’s broader strategy.
Option 2: Expand the audience
If your audience is too small, you may simply be exhausting available people.
Increasing audience breadth can distribute impressions across more users.
Option 3: Adjust the budget
If you’re pushing too much budget into a small audience, frequency can climb quickly.
Sometimes the problem isn’t the creative.
It’s the relationship between budget and audience size.
Option 4: Use frequency controls where supported
Google Ads supports frequency capping for Display and Video campaigns, allowing advertisers to limit how often ads appear to the same person.
But don’t confuse a cap with a fatigue strategy.
A frequency cap controls exposure.
It doesn’t automatically create better creative.
Use the Ad Fatigue Simulator Instead of Guessing
This is exactly where an interactive model becomes more useful than a static article.
Instead of reading:
“Frequency might increase fatigue.”
you can actually change the variables and watch what happens.
The Play2Lrn Ad Fatigue Simulator models the relationship between:
- Audience
- Budget
- Frequency cap
- Creative rotation
- Relevance
- Recall
- Conversions
- Fatigue
- Cost per conversion
The simulation runs through a 10-week campaign, making it easier to see the relationship between repeated exposure and campaign outcomes.
Try one scenario.
Start with a relatively broad audience.
Then increase the budget.
Watch what happens to frequency.
Now reduce the audience.
Then change creative rotation.
The point isn’t to find a universal magic number for ad fatigue frequency.
It’s to see why the number changes depending on the conditions around it.
Don’t just read about ad fatigue. Break the campaign and see what happens.
Ad Fatigue Frequency and Your Other Marketing Metrics
Frequency shouldn’t live in its own dashboard.
It connects directly to other parts of your marketing system.
For example, your attribution model determines how you interpret the contribution of different touchpoints.
That’s why it’s useful to pair this article with Marketing Attribution Models Compared: Last-Click vs. Linear vs. Time-Decay.
You can also connect fatigue to your CAC/LTV analysis.
If rising ad fatigue increases acquisition costs, your CAC can increase while the customer’s expected lifetime value stays unchanged.
That means the problem isn’t necessarily your product economics.
It may be your acquisition efficiency.
And if you’re running search campaigns alongside paid social, your understanding of Quality Score and auction economics can help separate creative fatigue from other advertising-cost problems.
These connections make ad fatigue much more than a “Facebook Ads metric.”
It’s part of the larger acquisition system.
The Biggest Mistake: Waiting for CPA to Collapse
By the time your CPA has doubled, the problem may have been developing for days.
That’s why ad fatigue frequency is best treated as an early-warning signal, not a standalone KPI.
Think about the hierarchy:
Frequency tells you about exposure.
CTR tells you about response.
CPC tells you about traffic cost.
CPA tells you about conversion efficiency.
ROAS tells you about economic return.
Put them together and you get a much clearer picture.
A frequency of 4 isn’t automatically a problem.
A frequency of 4 with falling CTR, rising CPC, rising CPA, and stagnant reach deserves investigation.
That’s the difference between looking at a metric and actually diagnosing a campaign.
FAQ: Ad Fatigue Frequency
What is ad fatigue frequency?
Ad fatigue frequency refers to the level of repeated advertising exposure associated with declining audience response. Frequency itself measures how many times people see an ad on average. Fatigue occurs when repeated exposure starts contributing to weaker engagement or less efficient results.
What is a good ad fatigue frequency?
There is no universal number. A suitable frequency depends on audience type, campaign objective, creative variety, budget, campaign duration, and brand familiarity. Practitioner benchmarks often use lower ranges for cold prospecting and higher ranges for retargeting, but these should be treated as starting points rather than fixed rules.
Does high frequency always cause ad fatigue?
No. High frequency means high exposure, not automatically poor performance. A campaign can have relatively high frequency while maintaining strong CTR and CPA. The more useful signal is whether frequency is rising while performance deteriorates.
How do I calculate ad frequency?
Use:
Frequency = Impressions ÷ Reach
For example, 50,000 impressions divided by 10,000 reached people produces a frequency of 5.
What is the difference between frequency and reach?
Reach measures how many unique people saw your ad. Frequency measures how often those people saw it on average. Google Ads provides both metrics to help advertisers understand audience exposure.
How can I reduce ad fatigue?
You can test new creative, expand the audience, adjust budget distribution, vary messaging, and use frequency controls where the advertising platform supports them. Most importantly, monitor frequency together with CTR, CPC, CPA, and reach rather than treating one metric as a universal threshold.
Final Takeaway
Ad fatigue frequency isn’t a magic number. It’s a pattern.
When frequency rises, ask what happens next.
Does CTR stay healthy?
Does CPC remain stable?
Does CPA remain under control?
Is reach still expanding?
Are people seeing different creative variations or the exact same message repeatedly?
Those answers tell you far more than a single frequency value.
And that’s the real advantage of modeling the problem.
Instead of asking:
“Is my frequency too high?”
ask:
“What happens to my campaign when frequency keeps increasing?”
That’s the question worth testing.
Play with the variables. Change the audience. Increase the budget. Rotate the creative. Watch the curve.